SELL OFF OF SPRING 2011

Large Cap Dow 30 Industrials Composite
Hallmarks of American Business and Industrial Innovation and Success
Large Cap Standard and Poor's 500 Stocks Composite
Current top Industrial Powerhouses in the American Economy
The Dow Jones 30 Industrial Composite Average Index DIA ETF
The Diamond of Success!
SELECT ADDITIONAL PAST ARTICLES BY TICKER:
Don't Fight The Fed
on Wed, Aug 1 • DIA, SPY •
Chart: The S&P And 'Should I Still Stay Away If I Sold In May?'
on Fri, Jul 13 • SPY, DIA •
Shorting Or Longing The Current 9 Percent Market Correction?
on Mon, May 21 • SPY, DIA •
The S&P: Is More Correction Coming?
on Mon, May 21 • SPY, DIA •
Powerful Results Last Week: Forecasting And Utilizing Key Broad Market Futures Daily Price Symmetries
on Mon, May 21 • CSCO, SPY, DIA •
May's Stock Market Volatility
on Fri, May 11 • DIA, SPY •
Chart: The XMI And Incredible Price Path Coordination In 2011 And 2012
on Tue, May 8 • XMI, DIA, SPY •
Last Week's Market Reversal And Present Straddle Opportunity
on Mon, May 7 • SPY, DIA •
Chart: The S&P And 'Sell In May' In An Election Year
on Fri, May 4 • SPY, DIA
August 1, 2012 | includes: DIA, SPY
April 30, 2012 | includes: SPY, DIA
May 4, 2012 | includes: SPY, DIA
ProtectVEST and AdvanceVEST By EchoVectorVEST
We're keeping watch for you!
Themes: DIA, DJX, /YM FUTURES, SPY, SPX, /ES FUTURES, QQQ, NDX, /NQ FUTURES, IWM RUT, /TF FUTRUES, OEX, XMI, MMI, Major Market Large Cap Composite Indexes, Stock Market Outlook, Market Analysis, Technical Analysis, Cyclical Analysis, Price Analysis
The S&P 500 SPY ETF
The Top 500 Industrial Powerhouses in the American Economy!
______________________________________________________________________________________________________________
"DOW CHART: TOPPY OR NOT?"
TUESDAY, FEBRUARY 26, 2013 | includes: DIA, /YM FUTURES, SPY, /ES FUTURES, QQQ, /NQ FUTURES, IWM, /TF FUTURES
Next month's options expiration, coming March 15TH, marks the one-year anniversary of the spring 2012's momentum price top for large cap composite equity indexes, as measured by the Dow 30 Industrial Average.
Although this 2012 mid-March price momentum top was re-touched again several times later that March and April, significant lower lows also followed. These lower lows continued until a market bottom for the year was reached in early June, with an almost 10% sell-off in the Dow having occurred.
Prices had fallen from a seasonal high of just over $132, to a June (early) low of $120.19, measured by the DIA ETF. It then took the rest of June, July, and part of August to recover back these gains. On the strength of this price recovery (fueled significantly by Central Bank action and intervention) the DIA climb an additional 2.5% into September, but only to collapse again to near prior summer lows by November, a pattern very similar to prior year price activity.
However, since November 2012, and further keeping with this annual price action pattern, the DIA has gained a remarkable 16% into the present month of February 2013.
With these strong gains since November, some market bears are suggesting the time is now ripe for large cap stocks to begin to correct again, especially after this impressive and extensive level of price recovery and gain. Many bears are considering both seasonality, and relatively lofty current price levels, in their assessments, as well as caution from additional pressures from a relatively faltering European market.
Market bulls, on the other hand, are pointing to things like potential commodity (industrial factor input) price destruction, increased equity demand inflows as an alternative to faltering bonds, and continued aggressive central bank financial engineering, to keep upward market price momentum going. Some bulls also point to the cyclical market benefits that often accompany the second term phase of a Presidency as well.
I believe this coming month of trading, and well into the March 15TH options expiration, could be very revealing regarding the possible continuation of positive market price momentum into this spring, and later into this summer.
I suggest focusing closely on price action and relative strength during the period that spans a week and a half preceding March 15TH, and the two to three week period that immediately follow expiration (particularly the 12 trading days after March 15TH, and beyond).
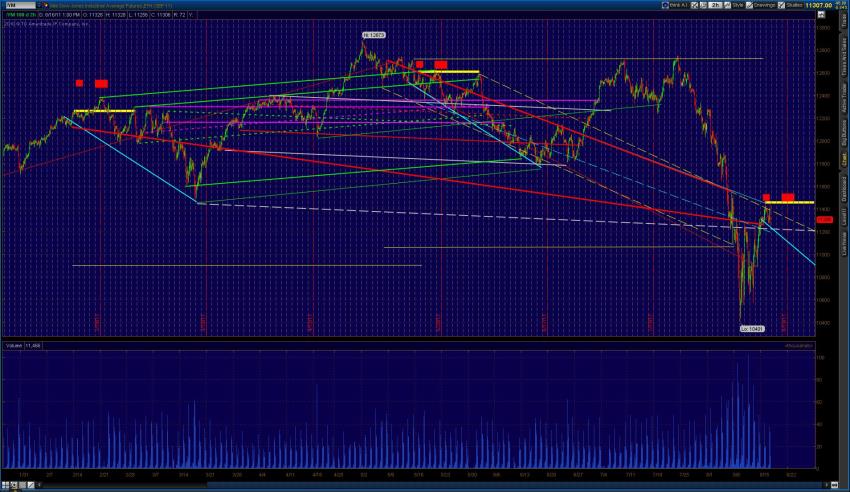
A review of my attached chart of the Dow 30 Industrials E-mini Futures might suggest that a period of potential opportunity on the long side (ceteris paribus) starting the first Tuesday of March, and going into March expiration, might be forthcoming. This long opportunity may then be followed by potential cautionary period, perhaps even a period warranting a good look at the possible employment of large cap portfolio insurance (especially following the 12TH trading day after the March 15TH expiration), if not an outright shorting opportunity period.
I also believe price action over the next 4 weeks may also help foreshadow what price levels the key cyclical price support, and subsequent market up-move later this year may launch from, regarding a broadly anticipated Regime Change Cycle (8 year) price low potentially due this October.
/YM Chart: Dow 30 Industrial Average E-mini Futures:
A 16-Month Daily OHLC Chart with Key Annual EchoVectors
and Quarterly Echo-Back Dates Illustrated
A Chart With Active Annual Price Vectors And Select Quarterly Echo-Strength Vectors Illustrated Generated From Key Coordinated Focus Echo-Back Time Points.
Coordinated Echo-Back Time Points:
1. 2ND Week if February, 2012, to 2ND Week if February, 2013, and
2. Week Preceding Options Expiration (Tuesday), March, June, September and December 2012.
Colors Of Coordinated EchoVectors Illustrated On Chart
Solid White: Annual EchoVector (QEV)
Dotted White: Annual Coordinate Forecast EchoVectors
Solid Green: Echo-Strength Vectors From First Tuesday of Month Coming Before Key Options Expiration Week.
(For high resolution chart viewng and analysis, click to go to publication. Then click on chart presented there to enlarge, and then right click again on chart to open into new tap, and then left click on larger chart in new tab to zoom further)
This article is tagged with: Market Outlook
Posted by EchoVectorVEST at 6:36 PM
Themes: DIA, DJX, /YM FUTURES, SPY, SPX, /ES FUTURES, QQQ, NDX, /NQ FUTURES, IWM RUT, /TF FUTRUES, OEX, XMI, MMI, Major Market Large Cap Composite Indexes, Stock Market Outlook, Market Analysis, Technical Analysis, Cyclical Analysis, Price Analysis
MDPP PRECISION PIVOTS Model-Generated
Traders Edge EasyGuideCharts
And Analysis
Highlighted With Key Active Focus Interest EchoVectors,
EchoBackDates, EchoBackTimePoints
And Coordinated Focus Interest Potential Opportunity Forecast EchoVectors
Your Technical Edge to Price Perspective and Change in the Composite Equites Index and ETF Market
"Staying ahead of the curve; We're keeping watch for you!"
PROTECTVEST AND ADVANCEVEST BY ECHOVECTORVEST MDPP PRECISION PIVOTS
DIA AND SPY ETF WEB PAGE
Could This Be A Correction That's Coming?
An EchoVector Pivot Point Perspective
Aug 7 2013, 10:17 | includes: DIA, IYM, SPY
Well, here we go again.
Just about this same time one quarter ago the stock market received information from viable Federal Reserve Bank connected journalist that a Fed tapering schedule in the Fed's bond buying program was in the works. See Seeking Alpha articles titled "Rumored WSJ Piece 'Fed Maps Exit From Stimulus No Joke After All" and "What the Federal Reserve Rat is Trying to Tell You?" As this news became confirmed over the next week, the stock market, which had not sold in May and gone away, but instead was rallying in May, began to falter.
By the end of June, and in an accompanying change of market sentiment, the Dow 30 Industrials, as measured by the DIA ETF, lost 8 points on a closing basis, which actually comes to what many market technicians consider an often healthy 5% correction.
In the meantime, The Fed more fully discussed its exit plan, reassuring the markets of its continued bond buying. The market subsequently regained its footing on this clarification, and resumed its relative strength again, and by mid-July climbed back to its prior highs. Earnings and outlook reports in the important month of July proved sufficient in the market's view to enable this successful second climb back to these strong price highs, the market regaining the powerful momentum which had been so effectively put in place by the central banks last summer in their globally orchestrated and concerted efforts at support and intervention. This intervention was very effective in stabilizing an American market in the midst of a presidential election year, and stabilizing world markets in the midst of broad European financial woes. Central bank intervention helped bridge the American market through some often daunting presidential cycle down-pressure (see my SeekingAlpha article "Don't Fight The Fed" published at the time) as we approached national elections.
Except for some relatively minor price consolidating times on the difficulty scale that occurred in late October, and then again shortly after elections and into the month of November's primary options expiration week (the November expiration served to reset and square up the post-earnings season and the post-election season from their "effects") the market has been remarkably strong in this year's Fed-led climate.
And now, with the arrival of every 100 point down day, especially one following a previous down day, and at these lofty price levels, we tend to see a flood of commentary coming forth and claiming, or at least asking, is this remarkable stock price appreciation party finally coming into a serious correction? Since my article last July I've resisted the urge to weight in and comment at such moments. But this month, and at these price levels, the timing finally seems particularly appropriate to me, and within my analytical framework. What I believe to be a very wise positioning opportunity within today's market context, going forward, has become particularly apropos this week. I will share my thinking, analysis, and approach in this article as an update to my previous article on the major large cap equity composite index market published this time last year.
Since my stock market ALERT on July 24TH, 2012 and my related article "Don't Fight The Fed" published within a week of my alert and identifying the "significant equities composite price bridge" being built by the central banks, the DIA ETF has rallied 30 points, from about $125 in July 2012 to about $155 in July 2013, about 24%.
The double-double long my model called for late July 2012 has proven to be particularly effective. In May of this year I called for a cover of that position at the DIA ETF price equivalency basis of $155, and concomitantly called for the opening of a double short on the large cap equities composites. I called for the cover of that short and the opening of a long position at DIA ETF $145 on July 24TH. Then I subsequently called for the cover of this position at DIA $154 on July 11TH, along with the issuance of a general seasonal alert.
I issued a reiteration of this seasonal alert on July 29TH last week, upgrading it to a Flex Point Alert at DIA ETF $155. This alert has me long above $155 and short below $155. So, on Tuesday of this week the market closed me in a short position.
The question now becomes, could this week be the start of the significant correction that has gotten so much press for almost four month? If so, I may want to add to my short, and double up? And if not, how might I remain ready for that? Well, with my $155 switch trigger still in place, I recognize I'm ready for a quick reversion back to a long position in the event the market strengthens again. In the meantime, where do I set my stops; even more specifically, were do I reset my switch trigger?
My answers to these questions are presented in the following EchoVector Pivot Point Analysis and Perspective on the /YM Dow 30 Industrials Composite Index E-mini Futures, using the key active 4-year presidential cycle echovector as a base reference and indicator, and utilizing the subsumed and coordinate 2-year congressional cycle echovector, the annual cycle echovector, and the tri-quarterly cycle echovector as complimentary indicators as well.
(Right click on the chart image to open it in a new tab. Left click on the image opened in the new tab to further zoom the EchoVector Analysis chart image and its illustrations and highlights.)
/YM Dow Industrials Composite Index E-mini Futures 4-Year Daily OHLC
In the chart above, note first the key active presidential cycle echovector (in solid bright white) running to last week's low, which occurred on Friday July 26, 2013, from the low on Wednesday July 29, 2009, being the low in the coordinate 4-year ago echo-back-week in 2009.
Also notice the price low of 8955 during this coordinate 2009 echo-back-week, and the price low of 15318 during its coordinate week in July 2013. This difference in weekly lows 4 years apart yields a price momentum appreciation value in the presidential cycle echovector's current price slope of 30.71 per week.
Note how this key echovector price slope momentum is also congruently reflected in key annual cycle echovectors (highlighted in solid red) during significant top and bottom range dates and periods within the current presidential cycle and its echovector determined price channel, and is also, interestingly, congruently reflected in the current active congressional cycle echovector that runs from echo-back-date Monday 8/1/11 to recent Monday 7/29/13.
Using this information, I project a dynamic target trigger price derived from this key active forecast echovector that proceeds from the Friday 7/26/2013 intersect value of 15343 and moves forward at a slope and rate of about 30.71 points per week. This rate has the pivot point trigger coming into Wednesday this week at about 49-50 points higher than 7/26, in the 15392-15393 range. This is a key dynamic echovector pivot point target calculation. The market price must stay above this pivot point price target and pre-set trigger switch on Wednesday, to keep the trigger from executing, and also in order to avoid signaling a possible downward pivot occurring in the presidential cycle. This dynamic presidential cycle echovector pivot point represent my first echovector pivot point support point (S1), as I also set it as my first directionally-sensitive position reversal trigger switch.
/YM Dow Industrials Composite Index E-mini Futures 2-Year Daily OHLC
The chart above is the same as the preceding chart, only zoomed in. In it we can see the annual echovectors highlighted in red and pink with greater clarity. The tri-quarterly echovector is highlighted in blue-purple.
First, note the upward pivot in the annual echovector that occurred in the first half of May. This surprised many analyst who were looking for a sell in May and go away effect to happen this year.
Second, note the parallel tri-quarterly echovector running to Tuesday 8/6/2013 this week from its echo-back-date of Tuesday 11/6/12. This is a particularly important detection, indicating that this powerful echovector momentum slope still remains in effect.
I will calculate (in much the same way as I did with my primary presidential cycle echovector pivot point reversal switch) the additional reversal switch triggers extending from the spaced blue-purple coordinate forecast echovectors below Tuesday's solid blue-purple tri-quarterly echovector. And I will prepare to employ them as needed. They constitute my second pivot point support level set, and set of position reversal switches (S2 - a, b, c & d).
It is important within the annual echovector to also recognize (1) the precipitous fall in prices that took place three quarter's back from Tuesday, and (2) the pausing football formation that took place this week and next a year ago and (3) two quarters ago and (4) one quarter ago (and how the football formation pause was followed by further short term price uplift one-quarter ago).
/YM Dow Industrials Composite Index E-mini Futures 15-Month Daily OHLC
This third and final chart is the same as the one before it, with two exceptions: (1) it's further zoomed, and (2) it includes an overlay in solid aqua blue highlight which illustrates the annual echovector for Monday August 5TH, 2013 and its echo-back-date of Monday August 6TH 2012 measured from the highs.
That high Monday a year ago was 13133. This week's Monday's high was 15597. This sets the echovector slope momentum at 47.38 per week, or 6.78 repeating per day. The coordinate forecast echovector with the dynamic echovector pivot points is also this time in solid aqua blue and runs parallel below it, extending from the next significant scope-relative pivot point low that followed the echo-back-date in 2012's price track.
That low occurred on Tuesday 9/4/2012 and came in at 12965, twenty-one trading days forward from the echo-back-date. Recognizing there are 252 trading days in the year has the reversal trigger coming in on Wednesday this week at 15223.67. This too is an important and dynamic echovector pivot point calculation. It constitutes my third pivot point support level set and position reversal switch (S3) in this analysis and preparation.
Conclusion And Positioning Implications
Could this week be the start of a coming correction? My answer is yes. And I wouldn't want to fight the Fed. But my bias is that a significant correction may also well not be becoming. But if it is, I don't think we would fall much below 2013 April lows. And we have a very good chance in my estimation of rallying from second half year lows well into next year.
The stock market has been particularly resilient in its ability to come back from price down-pressure this year. This phase of the 8-year regime change cycle bodes well for the market from levels established in mid-April going into next year. A good chart of the SPX illustrating this phenomena the last 20 years can be viewed at my SeekingAlpha posts by clicking here. For this reason my general bias remains primarily positive. However, "Don't Fight The Fed" remains in force, and if the Fed begins the process of a relative de-leveraging of the markets compared to what it has been doing, it must proceed very smoothly, and very cautiously about what it takes away, and when and how. And I wouldn't want to be on the wrong side of poor market reaction.
For this reason, I think it prudent to continue to use and place dynamic, active, and adjustable straddling positions in order to lock in gains and to better manage your exposure to general market price level changes in either direction. Setting advanced management straddles at key coordinate forecast levels is a very effective and opportune approach, and an advanced trade strategy. In this article I have provided an EchoVector Pivot Points Perspective and method for effectively determining trigger level prices, settings, and adjustments. Using this approach at this time could prove very valuable in effectively managing both market risk and reward.
One way to employ such a straddle would be to utilize the DIA ETF mentioned earlier in this analysis and using the approach illustrated with the /YM Dow 30 Industrials Composite Index E-mini Futures, by setting up an advanced trade technology approach (see "On-Off-Through Vector Target Price Switch") to positioning and position management, with appropriate dynamic triggers and stops included -- for example, at $154 on the DIA.
To perform the short side of the straddle, set a short trigger below $154 on the DIA pre-programmed as a "repeating short trigger switch" at this trigger level on reverse downtick action through the trigger price, with stops set to activate on reverse uptick up-through action. To perform the long side of the straddle, set a long trigger above $154 pre-programmed as a "repeating long trigger switch" on reverse uptick action through the trigger, with stops set to activate on reverse downtick down-through action.
I would continue to closely watch the 4-year presidential cycle echovector, the 2-year congressional cycle echovector, and the annual cycle echovector for continued symmetries and confirming parallels and early divergent tells. And I would keep calculating my echovector pivot points and employing my dynamic OTAPS On-Off-Through Vector Target Price Switch triggers.
This way you won't be fighting the Fed; and will in fact be letting the Fed, and the market, help point you in the direction you 'should be facing.' If a correction is coming, you will be ready. And if it isn't, you will be ready for that as well.
Share this article
About this article
Emailed to: 296,796 people who get Macro View daily.
Tagged: Macro View, Market Outlook
Problem with this article? Please tell us.
More articles by Kevin Wilbur »
Is Silver Setting Up For Significant Upside Price Action This Month? --Fri, Aug 9 2013
TodayToday's EchoVector Pivot Point Chart And Analysis: The Long Treasury Bond --Mon, Aug 5 2013
Today's EchoVector Pivot Point Chart And Analysis: Silver --Wed, Jul 31, 2013
Gold Charts: Warning In February Still Valid Today --Mon, May 20, 2013
As A Proxy For Stock Composites Holdings
The DIA, the SPY, the QQQ, and the IWM
FOR THE MOST RECENT ECHOVECTORVEST MDPP PRECISION PIVOTS
COMMENTARY, CHARTS, AND ANALYSIS ON
THE MAJOR MARKET FOR STOCKS AND STOCK ETFS SEE:
and
DOWPIVOTS.blogspot.com
SPYPIVOTS.blogsspot.com
STOCK-PIVOTS.com
MARKET-PIVOTS.com
PROTECTVEST@TWITTER
DIAPIVOTS@TWITTER
SPYPIVOTS@TWITTER
STOCK-PIVOTS@TWITTER
ETFPIVOTS@TWITTER
PRECISIONPIVOTS@TWITTER
MDPP PRECISION PIVOTS Model-Generated
Traders Edge EasyGuideCharts
And Analysis
Highlighted With Key Active Focus Interest EchoVectors,
EchoBackDates, EchoBackTimePoints
And Coordinated Focus Interest Opportunity Forecast EchoVectors
Your Technical Edge to Price Perspective and Change in the Major Composite Index Equties Market
"We're keeping watch for you!"
MAJOR GLOBALLY PUBLISHED AND SYNDICATED FORECAST AND ANLYSIS
Articles Published and Featured In 2013 In
NASDAQ.COM Official Site Of The Nasdaq Stock Market
CNBC ONLINE First In Business Worldwide
MARKETWATCH Stock Market Quotes, Business News, Financial News
MSN MONEY Investing
YAHOO FINANCE Business Finance, Stock Market, Quotes, News
SEEKING ALPHA Stock Market News and Financial News
BULLFAX Market News and Analysis
STREETINSIDER If You're Not Inside You're Outside
BIZWAYS Investment Opportunities And Industry News
FINANCIAL VISUALIZATIONS Financial Research, Analysis, and Visualization
FINANCE ROUNDTABLE Market Forecasts and Finance, UNC Chapel Hill
YAHOO FINANCE CANADA Business News, Real Time Stock Quotes, Investing Tools
NEWS NOW UK Industry, Sector, Commodity, Precious Metal News
THE ECONOMIC TIMES Business News, Personal Finance, Financial News
FINANCE PONG Global Financial And Market News
SEEKING ALPHA JAPAN Overseas Asia
ROYAL METALS GROUP The Trusted Name In Precious Metals
SHARPS PIXLEY NEWS Bullion Brokers London Since 1778
A-MARK PRECIOUS METALS Gold, Silver, Platinum - Charts and Graphs
STERLING INVESTMENT SERVICES Buy Side Research
GOLD NEWS TODAY Current Gold Prices And Precious Metals News
GOLD TREND Intelligent Gold Investing
GOLD PRICE TODAY Gold News
GOLD RATE 24 Gold News
INDONESIAN COMPANY Commodity News
REGATOR Only The Best Blogs
NEWSBLOGGED Latest News, Videos, and Live Videos
YAHOO VOICES General Yahoo Contributors' Network
and many more.
Copyright 2011-2022. PROTECTVEST AND ADVANCEVEST BY ECHOVECTORVEST MDPP PRECISION PIVOTS. All Rights Reserved.